


S-GAME’s action RPG *Phantom Blade Zero* combines Chinese martial arts with a unique worldview. It’s a game that takes players through a world the developers call “Kung Fu Punk.” The PC version supports DLSS 4.5 and ray tracing, so the graphics settings are certainly worth noting.
We’ve tested ray tracing in previous articles, but this title also supports NVIDIA’s DLSS 4.5. Using our standard GeForce RTX 5090-equipped PC, let’s take a look at the differences between rendering modes and the performance of each setting.
For this article, NVIDIA provided us with a game key for this title.
The PC specifications used for benchmarking are as follows:
CPU: AMD Ryzen 9 9950X
Memory: Micron DDR5-5600 128GB (4 x 32GB modules) *1
Motherboard: ASUS TUF Gaming B850-PLUS WIFI
Display: ROG Strix XG32UQ (3840×2160 / up to 160Hz) *2
GPU: NVIDIA GeForce RTX 5090 32GB
*1 The memory is operating at a frequency lower than DDR5-5600.
*2 The display is not overclocked; it is set to a fixed 144Hz with G-SYNC enabled.

We are using NVIDIA graphics driver version 621.14, which is the latest version at the time of writing.
 |  |
Resolutions are primarily set to 4K, 1440p (2K), and Full HD, with preset, super-resolution, frame generation, and ray tracing settings toggled as needed. The settings for each comparison are listed individually.
The measurement section covers the period from the first save point after completing the tutorial until the start of combat, and I proceed with as consistent movements as possible.
What’s the difference between standard ray tracing and path tracing?

In this game, you can choose between standard ray tracing and path tracing. According to the provided materials, even with standard ray tracing settings, Lumen’s indirect lighting effects are utilized in addition to reflections and shadows.
On the other hand, path tracing uses indirect lighting powered by NVIDIA’s ReSTIR GI. This affects visual effects such as light bouncing off objects and spreading to the surroundings, causing the colors of walls and the ground to be reflected onto nearby objects. Additionally, it includes caustics—patterns cast by light reflected and refracted off water surfaces.
Since simply listing technical terms can be confusing, let’s first compare the same scene side by side.
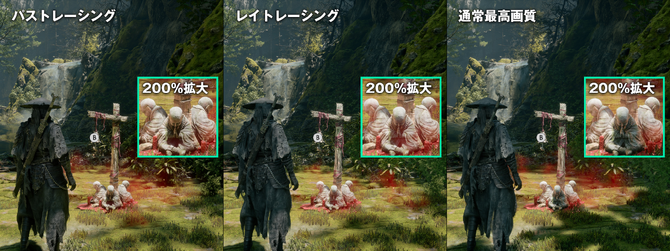
Pay close attention to areas where direct light doesn’t reach easily and to the ground where light reflects. In this comparison, path tracing deepens the shadows on the protagonist “Tamashii’s” back and the center of the stone statue, and differences in the transition between light and shadow are also evident. The changes in shading caused by the amount of incoming light are also easy to spot when compared side by side.
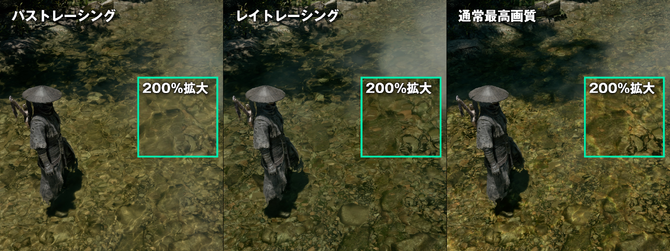
Comparing the water surfaces, differences were also evident in the outlines of the stones on the riverbed and the rendering of the light.In these comparison images, ray tracing gives the water’s surface a whitish, soft appearance, and when zoomed in, the outlines of the stones appear slightly blurred due to the waves. With standard ray tracing, the edges of the stones are relatively sharp, whereas at the highest standard graphics setting, the contrast on the riverbed is strong, and fine streaks of light are noticeable.

While I’ll leave the details to the article above, DLSS 4.5’s ray reconstruction significantly improves noise processing. In our previous tests, we saw improvements in the rendering of fine raindrops and the suppression of the phenomenon known as “boiling.”
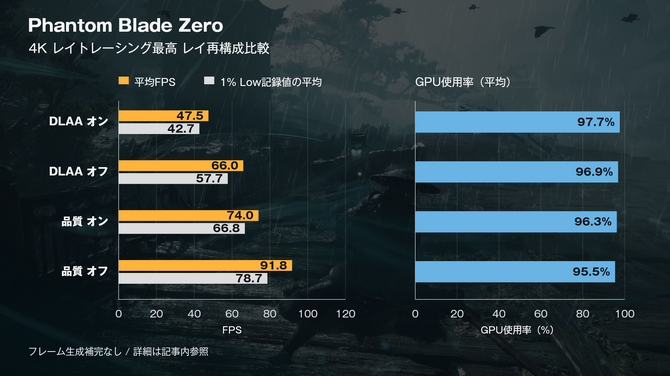
If you select ray tracing, ray reconstruction is automatically enabled and cannot be disabled; however, with standard ray tracing, you can choose to turn it on or off. In this test, we compared ray reconstruction while keeping all other settings fixed for both DLAA and the DLSS “Quality” setting.
The statement in the previous article that “the impact on performance is virtually negligible” referred to a comparison between the old and new models of ray reconstruction.The subject of comparison in this on/off test is different. NVIDIA’s official documentation explains that while performance may improve when multiple denoisers can be replaced, performance may drop—even if image quality improves—when ray tracing processing is involved or when there are few denoisers.
In these measurements, enabling ray reconstruction caused DLAA to drop by approximately 28% from an average of 66.0 fps to 47.5 fps, and DLSS “Quality” to drop by approximately 19% from 91.8 fps to 74.0 fps.It appears that a trade-off between image quality and performance will need to be considered when using standard ray tracing in this game.
First, let’s examine the rendering load without frame generation

While the visual effects are certainly of interest, performance is, of course, what we really want to verify. To start, let’s examine the differences based on image quality presets and resolution without using frame generation.

Anti-aliasing is set uniformly to DLAA, “Super Resolution Output Resolution” is set to 100%, and Frame Generation is turned off. First, we’ll enable path tracing and compare results by changing the resolution and image quality presets.
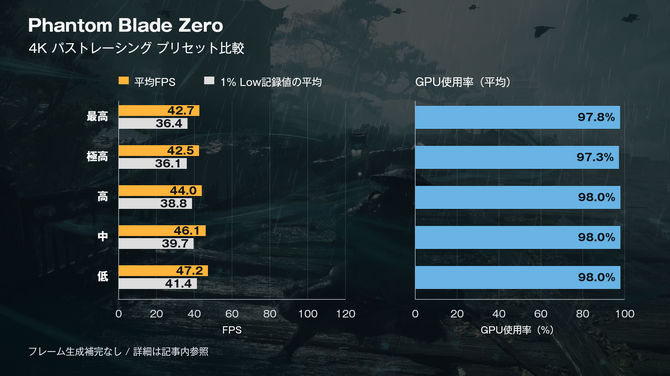 | 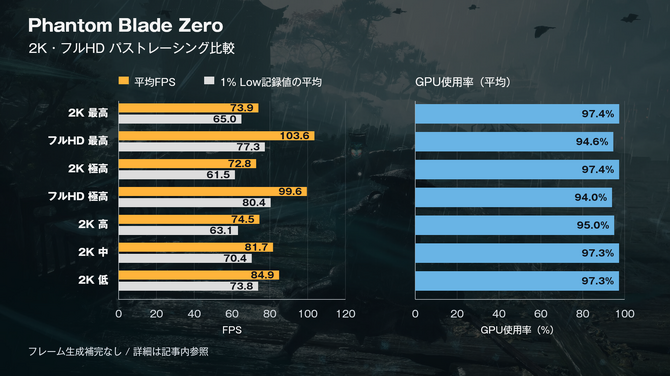 |
Even with the RTX 5090, the results at 4K were extremely demanding, averaging in the 40s fps. The fact that the average only exceeds 60 fps at 2K highlights just how high the load is.
Next, using the same settings—DLAA, “Super Resolution Output Resolution” set to 100%, and Frame Generation turned off—we’ll examine the differences in resolution and presets between standard rendering and ray tracing. For the ray tracing comparison, we’ve enabled ray reconstruction.
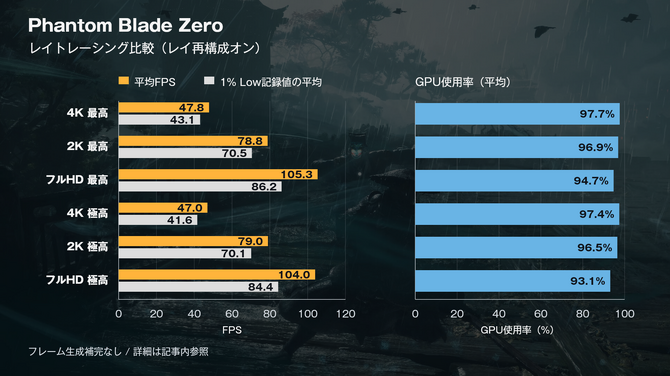
With ray reconstruction enabled for ray tracing, the average frame rate at maximum settings was 47.8 fps at 4K, 78.8 fps at 2K, and 105.3 fps at Full HD.When comparing the highest settings across resolutions, 2K showed an improvement of approximately 65% compared to 4K, while Full HD reached approximately 2.2 times the performance of 4K. While the average frame rate fell below 60 fps at 4K, it was close to 80 fps at 2K and exceeded 100 fps at Full HD, clearly demonstrating performance differences based on resolution.
On the other hand, the difference in average FPS between the “Max” and “Ultra” presets was within about 2% at each resolution.In this round of testing, which consisted of a single run under each condition, we did not observe a clear performance boost from lowering the preset by one level. GPU utilization decreased slightly as the resolution was lowered, but even at Full HD, it averaged 93–95%, remaining at a relatively high level.
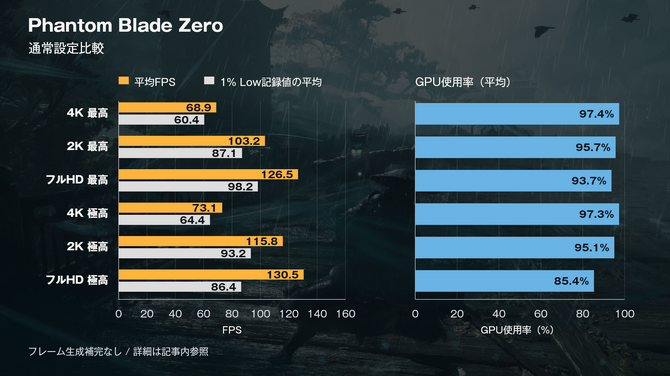
At “High” quality with standard settings, the average frame rate was 68.9 fps at 4K, 103.2 fps at 2K, and 126.5 fps at Full HD. In these tests, the average frame rate exceeded 60 fps even at 4K.
When the settings were lowered to “Ultra High,” 4K reached 73.1 fps and 2K reached 115.8 fps—improvements of approximately 6% and 12%, respectively, compared to the highest settings. Meanwhile, Full HD reached 130.5 fps, with an increase of only about 3%.
One point of concern is that the average 1% Low frame rate for Full HD dropped from a peak of 98.2 fps to 86.4 fps at the “Ultra High” setting. The average GPU utilization also decreased from 93.7% to 85.4%, showing a different trend from the average FPS.
Let’s also try switching DLSS here. Using 4K, “Ultra,” and ray tracing as common conditions, we’ll compare DLAA with DLSS’s “Quality,” “Balanced,” “Performance,” and “Ultra” settings.
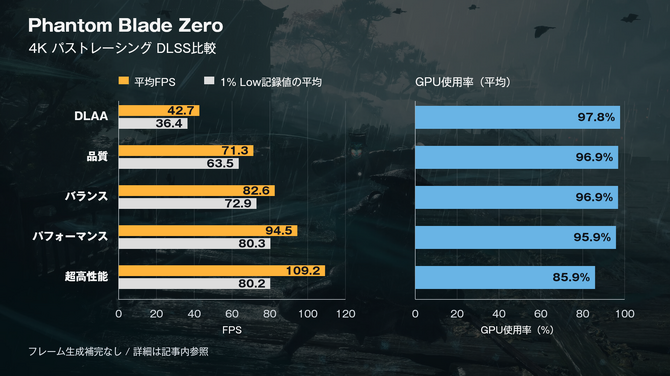
The super-resolution effect of DLSS is significant: in a 4K ray-tracing environment, the “Quality” setting achieved 71.3 fps—an improvement of approximately 67% compared to DLAA’s average of 42.7 fps.It exceeded an average of 60 fps without using frame interpolation, making it an effective option for reducing the load on ray tracing. Since “Balanced” mode reached 82.6 fps and “Performance” mode reached 94.5 fps, you’ll want to choose the setting that best matches your target frame rate while comparing image quality.
On the other hand, while the “Ultra-High Performance” setting recorded an average of 109.2 fps, its average 1% Low value was 80.2 fps—virtually unchanged from the “Performance” setting’s 80.3 fps.Average GPU utilization dropped from 95.9% to 85.9%. In these tests, the improvements from the “Ultra-High Performance” setting were primarily reflected in the average frame rate; no improvement in the average 1% Low value was observed compared to the “Performance” setting.
Can Just Frame operation be achieved with up to 6x frame generation?
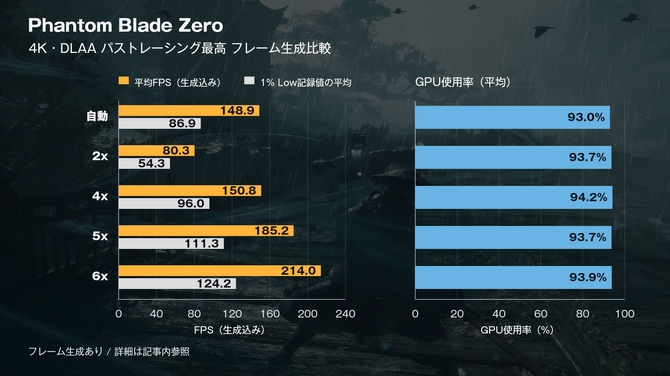
In this game, you can use fixed settings ranging from 2x to 6x, as well as a dynamic setting that automatically adjusts the multiplier. The comparison was conducted at 4K resolution with all settings maxed out, ray tracing enabled, and DLAA applied.
The average frame rate, including frame generation, was 80.3 fps at 2x, 150.8 fps at 4x, 185.2 fps at 5x, and 214.0 fps at 6x.The 6x setting is approximately 2.66 times that of 2x, demonstrating that increasing the fixed magnification yields measurable performance gains. The automatic setting recorded 148.9 fps, a result close to the fixed 4x setting based on these averages.
When comparing fixed magnifications, the average PC latency increased from 59.4 ms at 2x to 65.4 ms at 6x. Even if the displayed FPS increases, it doesn’t necessarily mean that input responsiveness improves to the same extent.Control responsiveness is something I always pay close attention to, as *Phantom Blade Zero* is an action game centered around repeated attacks and just-in-time dodges.
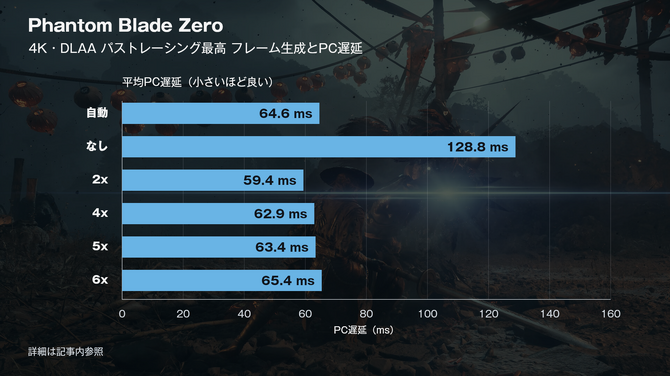
In this test, we’re comparing PC latency as recorded by the PC itself. This metric includes CPU processing and differs from the total latency from input to display, which also accounts for mouse and display latency. The unit is milliseconds (ms), and a lower number indicates less latency.
In these measurements, the average PC latency without frame generation was 128.8 ms, whereas with frame generation enabled, it ranged from 59.4 to 65.4 ms. However, this difference may be influenced by multiple factors, such as NVIDIA Reflex control and GPU load, and does not necessarily indicate that frame generation itself improves latency.It is important to distinguish between the frame rate after generation and actual input responsiveness.

In actual combat, I struggled to time my dodges perfectly at 4K with maximum graphics settings and frame generation disabled, resulting in numerous game overs. On the other hand, when I lowered the resolution or graphics settings, I felt it became easier to time my dodges correctly.
Since it also supports NVIDIA Reflex, this feature has become indispensable for high-speed action games like this one that demand low latency.
"Phantom Blade Zero" on the RTX 5090

In this test, even on the RTX 5090, the combination of 4K, ray tracing, and DLAA resulted in a sluggish average of 42.7 fps.On the other hand, setting DLSS to “Quality” boosted the average frame rate to 71.3 fps, so if you want to enjoy ray tracing at 4K, you’ll want to start by adjusting the super-resolution settings.
The figure of 214.0 fps on average—achieved through up to 6x frame generation—is certainly eye-catching, but this is an action game where timing your dodges to anticipate attacks is crucial. In addition to the displayed FPS, you’ll want to fine-tune your settings while paying attention to how the controls feel during actual gameplay.
You’ll want to take in the scenery while you’re at it, and you won’t want to miss a single moment of dodging. Don’t get too hung up on the highest settings—instead, find the configuration that best suits your PC and your playstyle, and enjoy the kung fu action of *Phantom Blade Zero*.



